


Early career challenges at Leiden University: An analysis of the Work Experience Survey 2025
YAL was given access to results of Work Experience Survey 2025. Early career academics are currently left behind by the university, as our comparative analysis demonstrates. Improving the position of early career academics is not a marginal issue but a strategic necessity.
The Work Experience Survey 2025, designed and executed by the company Welliba, has sparked some controversy. For example, Tim Mickler and Joop van Holsteyn criticized the survey’s methodology in Mare, pointing out the lack of clear concepts, ambiguous phrasing of questions, and the absence of options to skip questions. Taking these issues into consideration, the survey was still completed by over half of the university’s employees and could thus tell us something about aspects of our university that need improvement. In this post, we use data from the survey to show that early career academics are currently left behind by the university.
YAL was given access to a dashboard containing results of a part of the survey (excluding key aspects of social safety). The dashboard contains aggregated quantitative data and ‘AI summaries’ of qualitative data – which pose their own problems, as it is not clear how well these summaries reflect actual answers given by respondents. We have decided to use the AI quotes in lieu of more direct data.
Using the options available in the dashboard for creating sub-groups, we asked for aggregated results separately for early career academics, defined as academic staff up to the age of 44 years (the majority of whom are ‘Teacher’ (i.e. docent), ‘Researcher’ (i.e. postdoc), or ‘Lecturer’ (i.e. university lecturer/UD)); and senior academics, defined as academic staff of 45 years and over (this includes the majority of senior university lecturers/UHD and professors). PhD candidates are excluded from our analysis. It should be noted that employees over 45 can also be early career researchers, if they started their academic career later in life; however, the dashboard does not permit a selection based on number of years since the PhD was obtained.
Differences in Key Metrics
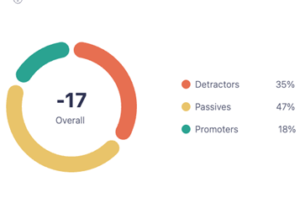
The dashboard provides insight into different aggregated ‘Key Metrics’ that give an indication of employees’ general satisfaction with their work and the organisation. The results show clear differences between the experiences of early career and senior academics. For instance, the dashboard gives an ‘Employee Net Promoter Score’, which “measures how likely employees are to recommend working at their organisation to a friend.” The score, which can be below or above 0, indicates whether there are more ‘detractors’ (contributing to a negative score) or ‘promotors’ (contributing to a positive score). For the university as a whole, the Employee Net Promoter Score is -6. But among early career academics, it is a mere -17. Meanwhile, senior academics obtain a score of -12. The score of only those at the level of UHD (senior university lecturer) or professor is even positive at +1. It thus seems that senior academics are happy in their position, especially if they have made promotion, while academics earlier in their career would not even recommend working at Leiden University to their friends.
The same pattern is found in other key metrics, such as ‘Trust’, defined as “an individual’s belief in the ability and reliability of their organisation, along with the individuals who work there and oversee its operations.” As Mare already reported, only 12% of employees have a high level of trust in their organisation. For early career academics, the percentage is even lower than the university’s average score, whereas for senior academics it is higher than average.
Clear differences can also be seen in the key metrics ‘Growth’ and ‘Career’. Growth is defined as “an individual’s belief in their ability to develop their competencies, skills, knowledge, and character throughout their life.” The metric ‘Career’ refers to “an individual’s perception of their career and whether they view it as a continuous process of development, along with the extent to which they believe that their career offers them opportunities for continuous learning, growth, and self-development.” For both metrics, early career academics score lower than the university average whereas senior academics score higher. Exactly those people for whom growth and career progression are most important are least satisfied with those aspects of their job.
Early career challenges
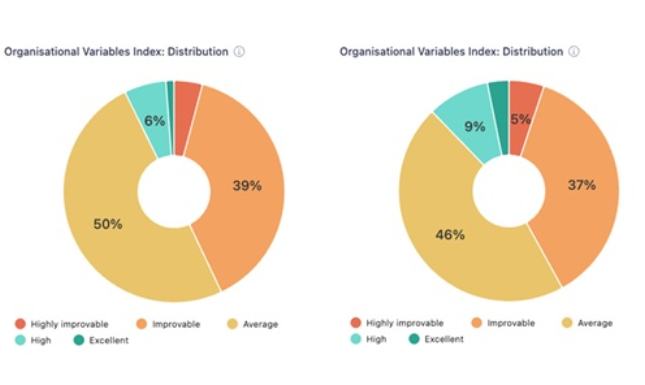
In addition to the key metrics, the dashboard contains results on various ‘Organisational Variables’: Conditions, Strategy & Culture, Communication, Career, Work Content, People & Teams, and Personal Life. The scale is based on the difference between ‘boosters’ (how many people rated this aspect ‘very positive’) and ‘blockers’ (how many rated it ‘very negative’). The average score on these organisational variables for early career academics is again lower than both senior academics and the university as a whole. Indeed, early career academics lag behind senior academics on each of the five organisational variables apart from Personal Life.
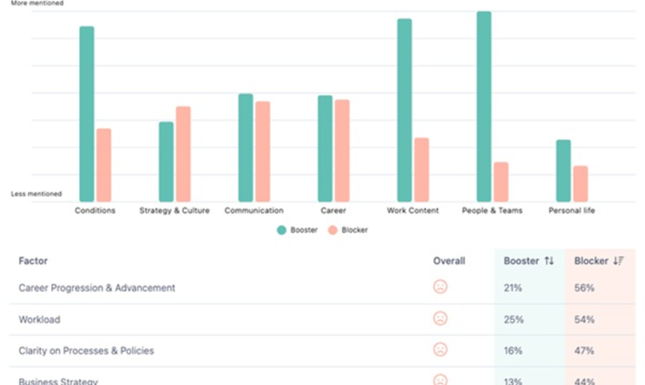
The top five ‘blockers’ affect a substantial proportion of early-stage academics, with career progression and advancement and workload reported most frequently, followed by clarity of processes and policies, business strategy, and top-down communication. Given the central importance of these factors for career development, motivation, and long-term retention, their prevalence is a matter of concern. Barriers related to career progression point to structural uncertainties around promotion criteria, evaluation practices, and access to stable career paths. When combined with high workload, these uncertainties may limit the time and cognitive space available for activities that are critical for academic advancement, such as publishing, grant writing, and skills development.
Moreover, the high share of respondents reporting insufficient clarity of processes and policies suggests that early career academics may struggle to navigate institutional rules and expectations, increasing dependence on informal knowledge and personal networks. Similarly, perceived shortcomings in business strategy and top-down communication may weaken alignment between institutional priorities and individual career planning, leading to reduced trust in leadership and lower perceived agency among junior staff. Taken together, these blockers do not operate in isolation but are likely mutually reinforcing: heavy workloads can exacerbate the negative effects of unclear policies, while weak communication and strategic ambiguity may amplify concerns about career prospects. The comparison to the university averages and to senior researchers as presented in Table 1 (see the Appendix) highlights key differences between early career academics and other groups.
In more detail, one of the topics with a very clear difference between the experiences of early career and senior academics is Rewards. The main issue for early career academics when it comes to rewards is ‘Good base salary’. According to the AI summary of this topic, there is “a strong sentiment that the organization does not adequately recognize or reward the contributions of its staff, particularly those who take on additional responsibilities without corresponding financial or career benefits.” To this, we could add the fact that a professor can easily make twice as much as a new UD!
Another topic about which early career academics are especially unhappy is Career Progression & Advancement. Over half of early career academics consider this a ‘blocker’ in their work. The AI summaries clarify that “[a] significant number of employees express concerns about the lack of clear pathways for advancement, particularly for those on temporary contracts or in lower pay scales.” The GROW interviews were also criticized; they are “perceived as bureaucratic formalities lacking meaningful outcomes, which diminishes their effectiveness in fostering professional growth.” Moreover, the promotion process is perceived as unfair: “[m]any feel that the criteria for promotions are unclear or inconsistently applied, leading to perceptions of favoritism and nepotism.” YAL has published several position papers with recommendations on this topic: Career Policy: Lifting the Fog of Professional Perspectives (2021) and recommendations regarding promotion criteria (2025). In light of the results of the Employee survey, these recommendations remain timely and relevant.
Learning & Development Opportunities is a third topic on which there are clear differences between the scores of early career and senior academics. A third of early career academics consider this a blocker in their work. The AI summary states that, employees criticize “[t]he compulsory nature of certain training courses […], as many felt these do not contribute meaningfully to their professional growth and instead add to their workload” and trainings that are of “low quality and relevance, with a perception that they are disconnected from actual job requirements.” This may refer to requirements such as the BKO. For the university, it may be worthwhile to re-evaluate the offered courses and their connection to job requirements.
Collective struggles
There are also issues on which early career and senior academics score similarly, and which can be seen as collective struggles among the academic ranks. With regard to Strategy and Culture, early career and senior academic indicate similar dissatisfaction, but early career academics score lower on every metric. This is described in the AI summary: “[a] prominent theme is the perceived disconnect between the university’s stated values and actual practices, with many employees feeling that core values are not genuinely upheld, particularly in relation to social safety and academic freedom.” The work environment is described as “toxic, with reports of intimidation and a lack of support from management. This has fostered a sense of fear and uncertainty, prompting some employees to seek opportunities elsewhere.”
Both early career and senior academics score poorly on their satisfaction with Communication, again with early career academics scoring slightly worse. As the AI summary states, there is “a sense of discomfort among employees when it comes to providing feedback, especially to senior colleagues, indicating a hierarchical culture that discourages open communication.”
Workload is a main concern for early career and senior academics equally. The main issues are ‘Manageable workload’ and ‘Time and space for rest and recovery’. The importance of this long-running issue has already been stressed by the University Council, but there is no plan for improvement yet. YAL has already published a position paper on Structural Changes to Tackle Work Pressure back in 2021, which has seen little uptake.
On a slightly happier note, not all is bad at Leiden University. Both early career and senior academics are overall happy about their colleagues, the flexible working arrangements, the autonomy they experience, and the purpose, meaningfulness and impact of their work.
Follow-ups and recommendations
While the Work Experience Survey 2025 has clear methodological limitations, its results nevertheless point to persistent and structural problems in the working conditions of early career academics at Leiden University. These findings call not only for reflection, but for concrete and transparent follow-up.
First, we recommend that future surveys be improved methodologically by using clearer concepts, consistent phrasing of questions, and full transparency about data access and analysis. In particular, raw qualitative data (appropriately anonymised) should be made available to representative bodies, rather than relying solely on AI-generated summaries, and dashboards based on indices for which their psychometrics properties cannot be independently verified.
Second, survey outcomes should be systematically translated into faculty- and institute-level action plans, with clear ownership, timelines, and accountability. Staff should be informed not only of the results, but also of what concrete measures will follow, how progress will be monitored, and when feedback will be revisited. Without visible follow-up, repeated surveys risk reinforcing cynicism rather than improving trust. Now it seems that some faculties and institutes have discussed the survey results with staff and have in some cases made action plans, while others have not or only superficially.
Third, given the consistently low scores on career progression, workload, communication, and strategy – particularly for early career academics – we recommend prioritizing a limited number of structural interventions rather than dispersing efforts across many small initiatives. These should include transparent career frameworks, enforceable workload norms, and clearer communication about institutional priorities and decision-making processes. Many of these issues have been addressed by YAL before, with concrete recommendations like a shorter and more clearly structured academic year and implementing a ‘rolling grant’ fund for all academics, but often with too little progress.
Finally, we stress that improving the position of early career academics is not a marginal issue but a strategic necessity. Early career academics are the future of this university, after all. Addressing the concerns raised in this survey is essential for safeguarding academic quality, retaining talent, and ensuring the long-term sustainability of the university as a scholarly community.
Appendix
|
Metric |
University |
Early career academics |
Senior academics |
UHDs/professors |
|
Organisational Variables Index |
2.7 |
2.5 |
2.6 |
|
|
Rewards |
2.6 |
2.4 |
2.6 |
2.9 |
|
Career Progression & Advancement |
2.1 |
1.7 |
2.0 |
2.3 |
|
Learning & Development Opportunities |
2.5 |
2.2 |
2.6 |
2.8 |
|
Business Strategy |
2.0 |
1.9 |
2.0 |
2.0 |
|
Company Mission & Values’ |
2.3 |
2.1 |
2.3 |
2.3 |
|
Clarity on Processes and Policies |
2.0 |
1.9 |
2.0 |
2.0 |
|
Top-Down Communication |
2.1 |
2.0 |
2.1 |
2.3 |
|
Workload |
2.2 |
1.9 |
1.9 |
1.9 |
Table 1. Comparison of the aggregate average scores at University level to the average scores of the three sub-groups of interest per organisation variable index, and separately for the eight variables that the index is composed of.
0 Comments